Table of Contents
Introduction to Google Lighthouse
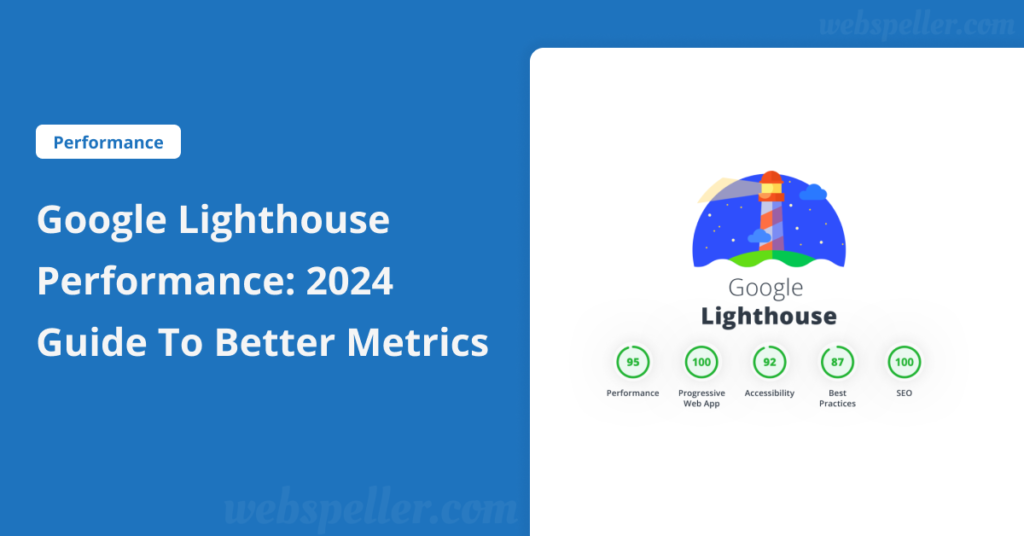
Google Lighthouse performance is essential for evaluating and improving a website’s performance, accessibility, best practices, and Search Engine Optimization (SEO). Developed by Google, this open-source tool offers developers, designers, and website owners valuable insights and recommendations to enhance their sites’ overall quality and user experience.
Lighthouse conducts audits by simulating the loading and rendering of web pages in a controlled environment. It measures key Google Lighthouse performance metrics such as page load speed, network efficiency, rendering performance, and interactivity. It also assesses accessibility aspects like proper HTML structure, image alt text, and keyboard navigation. In addition, Lighthouse examines adherence to best practices, including secure HTTPS connections, image and code optimization, and responsive design.
Once the audits are complete, Google Lighthouse performance reports are generated, providing a performance score alongside detailed recommendations for improvement. These reports highlight the website’s strengths and pinpoint areas needing optimization, offering actionable steps, code snippets, and resources to enhance performance and user experience.
Google Lighthouse performance is widely embraced by developers, designers, and website owners as a reliable tool for identifying performance bottlenecks, accessibility issues, and SEO deficiencies. By implementing Lighthouse’s recommendations, website owners can create faster, more accessible, and search engine-friendly websites that deliver an exceptional user experience.
Google Lighthouse Metrics: Navigating and Understanding the Report Insights
Lighthouse reports offer a deep dive into a website’s performance, accessibility, SEO, and overall user experience. They provide actionable insights and recommendations to help optimize your site.
Here are some key metrics you can expect to find in a Lighthouse report:
Performance metrics
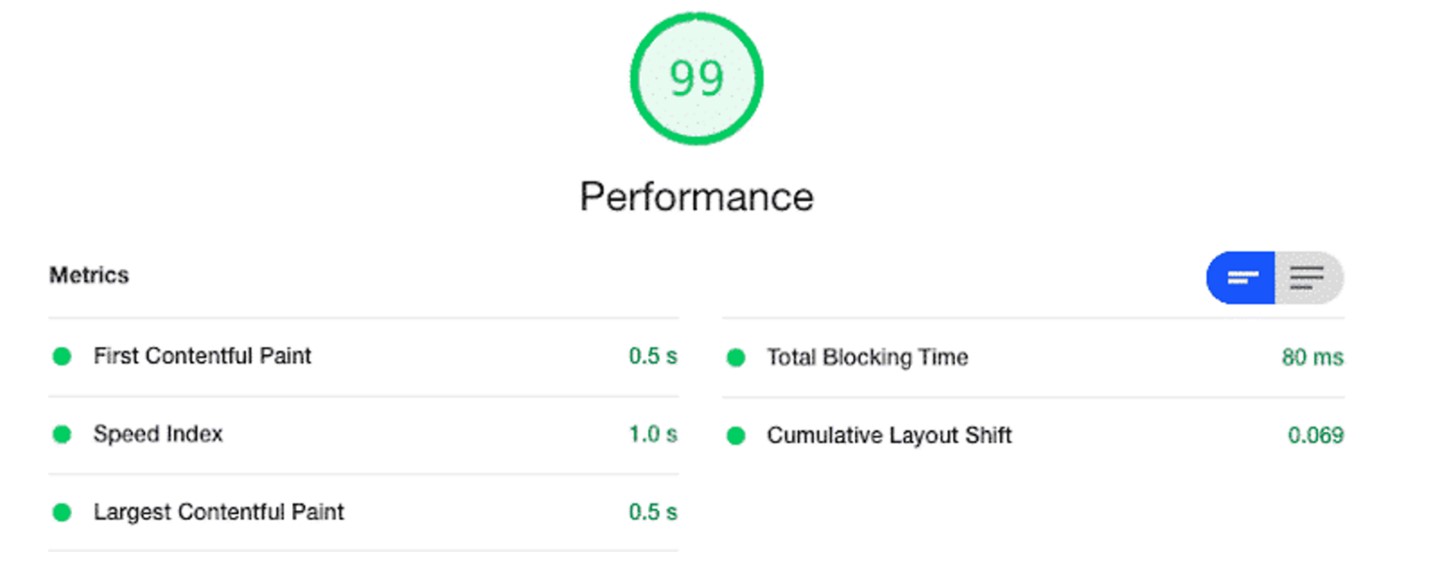
Lighthouse measures performance-related metrics that evaluate a website’s loading speed and responsiveness. This helps identify areas for optimization.
First Contentful Paint (FCP)

First Contentful Paint (FCP) measures the time it takes for a website’s first piece of content to appear on the screen. This gives users a visual cue that the page is loading.
FCP specifically tracks the rendering of the “primary content,” such as text, images, or other meaningful elements. It doesn’t include background tasks like loading scripts or stylesheets, which might not affect the immediate visual experience.
FCP is crucial because it offers a user-centric view of page load speed. Measuring how quickly users see something meaningful helps evaluate a website’s perceived performance and initial impression.
A lower First Contentful Paint (FCP) time means a faster-loading website, leading to a better user experience. For optimal results, aim for under 1-2 seconds.
By monitoring and optimizing FCP, developers can identify and fix performance issues that slow down initial content rendering. This includes large resource sizes, slow server responses, and inefficient code execution. Improving FCP can significantly enhance a website’s perceived performance, user satisfaction, and potentially conversion rates.
How to Improve First Contentful Paint (FCP)
Improving First Contentful Paint (FCP) time is crucial for enhancing your website’s loading speed and overall performance. By following these strategies, you can ensure faster rendering of the initial content and a better user experience.
- Optimize Server Response Time Reduce server response time by optimizing configurations, utilizing caching techniques, and leveraging Content Delivery Networks (CDNs) to deliver static assets closer to users.
- Minimize Render-Blocking Resources Identify and minimize render-blocking resources like CSS and JavaScript. Inline critical CSS or load it asynchronously to speed up the rendering of the initial content.
- Compress and Optimize Images Compress images to reduce file size without compromising quality. Use modern formats like WebP and implement responsive image techniques such as lazy loading or srcset attributes for delivering appropriately sized images.
- Prioritize Visible Content Ensure that critical, above-the-fold content is rendered first. By prioritizing visible content, users will perceive faster loading times, even if other resources are still being loaded.
- Eliminate or Defer Unnecessary Third-Party Scripts Evaluate third-party scripts and remove or defer non-essential ones. Load non-critical scripts asynchronously or after the initial content is displayed to improve FCP.
- Optimize CSS Delivery Minify CSS files, remove unused styles, and consider inlining critical CSS to reduce network requests, improving rendering performance.
- Enable Browser Caching Set up proper caching headers to allow the browser to cache static resources, reducing load times on subsequent visits and improving page performance.
- Implement Code and Asset Optimization Minify and compress HTML, JavaScript, and CSS files. Use code-splitting techniques to load only necessary resources for each page, optimizing FCP.
- Use Performance Monitoring Tools Leverage tools like Google Lighthouse, PageSpeed Insights, and browser developer tools to monitor and identify performance bottlenecks. These tools provide actionable insights to improve your FCP and overall website performance.
Speed Index (SI): Optimizing Your Website’s Visual Load Time
Speed Index (SI) is a key performance metric that measures how quickly the visual contents of a web page are rendered during loading. Unlike other metrics like First Contentful Paint (FCP), which focuses on the first visible element, Speed Index evaluates the overall progression of content rendering, providing a more holistic view of a page’s perceived load time.
While FCP tracks when the first content appears, Speed Index measures the average time at which visible elements become viewable. This allows for a more comprehensive understanding of how fast users can see and interact with the page. A lower Speed Index value indicates a faster visual load time, improving user experience and engagement.
A fast Speed Index is essential because it captures the entire loading experience, factoring in both the order and speed at which content is rendered. It offers a deeper insight into page load speed than isolated metrics like FCP or Time to Interactive (TTI).
How to Improve Speed Index
To improve Speed Index, apply similar optimization strategies used for other performance metrics:
- Optimize server response time by configuring servers efficiently and using CDNs.
- Minimize render-blocking resources like CSS and JavaScript.
- Compress and optimize images with modern formats such as WebP.
- Prioritize visible content by loading above-the-fold elements first.
- Optimize CSS and JavaScript delivery by minifying and removing unused code.
By enhancing these factors, you can significantly reduce visual load time, resulting in a lower Speed Index and a faster, more responsive website.
What’s a Good Speed Index Score?
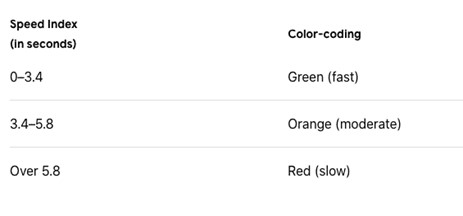
A good Speed Index score should be under 3.4 seconds. Achieving this can greatly improve user experience and your site’s overall performance.
Largest Contentful Paint (LCP): Optimizing Your Website’s Key Performance Metric
Largest Contentful Paint (LCP) is a crucial performance metric that measures the time it takes for the largest visible content element to fully render within the viewport. This metric evaluates the loading speed of the most significant content users see when they first visit a webpage, making it critical for user experience.
Typically, the largest content element considered for LCP is an image, video, or block-level text. Since it represents the primary content users are interested in, LCP plays a major role in shaping the user’s perception of page load speed.
A fast LCP means the main content becomes visible quickly, allowing users to engage with the page sooner. Improving LCP contributes to a better user experience by reducing perceived loading time, which can help boost both user satisfaction and SEO performance.
How to Improve Largest Contentful Paint (LCP)
To achieve a good LCP score, it’s essential to optimize various aspects of your website’s performance. Here are some effective strategies:
- Optimize Images Compress and properly size images to reduce load times. Use modern formats like WebP, implement lazy loading, and use responsive image techniques to deliver optimized images across devices.
- Prioritize Critical Content Ensure that the largest content element, along with other important above-the-fold elements, loads quickly. Prioritize critical resources and minimize render-blocking elements that delay the rendering process.
- Improve Server Response Times Optimize server configurations, implement caching, and leverage Content Delivery Networks (CDNs) to reduce server response times and improve content delivery speed.
- Optimize CSS and JavaScript Minify and compress CSS and JavaScript files to speed up parsing and execution. Remove unused code and streamline delivery to avoid render-blocking that can slow down LCP.
Continuous Monitoring for LCP Improvement
Regularly monitor your site’s LCP using tools like Google Lighthouse and PageSpeed Insights. By tracking performance and making necessary optimizations, you can enhance Largest Contentful Paint and deliver a better overall user experience.
What is a Good LCP Score?
For an optimal user experience, aim for an LCP of 2.5 seconds or less for at least 75% of page visits. Achieving this can significantly improve your site’s loading speed and search engine rankings.

Cumulative Layout Shift (CLS): Ensuring Visual Stability for Better User Experience
Cumulative Layout Shift (CLS) is a critical performance metric that measures the visual stability of a webpage during the loading process. It evaluates the amount of unexpected layout shifts that occur as content loads, impacting the user experience by quantifying how stable the page remains as elements are rendered.
Layout shifts happen when elements on a webpage change position or size unexpectedly, causing the content to move. These shifts can disrupt the user’s experience and cause frustration. CLS tracks the cumulative effect of these shifts, providing insights into a page’s overall visual stability.
This metric is especially important when content is loaded asynchronously or when dynamic elements like images, ads, or videos are inserted after the initial load. By minimizing layout shifts, websites can improve user engagement and performance.
How CLS is Calculated
CLS is determined by multiplying the impact fraction (the percentage of the viewport affected by the shift) by the distance fraction (the distance the element moves in relation to the viewport size). The CLS score ranges from 0 to 1, with lower scores indicating greater visual stability.
Strategies to Reduce Cumulative Layout Shift
- Set Size Attributes for Images and Videos Always specify the width and height for images and videos. This ensures the browser allocates space before they load, preventing sudden layout shifts when these elements appear.
- Reserve Space for Ads and Dynamic Content Reserve dedicated space for ads, images, and other dynamically loaded content to avoid layout shifts when these elements are inserted.
- Avoid Inserting Content Above Existing Content Ensure new content added to the page doesn’t push existing content down. Use techniques like pre-rendering or placeholders to prevent layout disruptions.
- Load Fonts and Resources Early Prioritize the loading of fonts, scripts, and other resources to prevent layout shifts caused by delayed rendering or sudden content appearance.
- Test and Monitor CLS Regularly use tools like Google Lighthouse and browser developer tools to monitor CLS and identify problem areas. Continuous testing ensures your site maintains optimal visual stability.
What’s a Good CLS Score?
For an optimal user experience, websites should aim for a CLS score of 0.1 or less. To achieve this, ensure that at least 75% of page loads—across both mobile and desktop—meet this target. Lowering your CLS improves page performance, enhances user satisfaction, and can positively affect your SEO rankings.

Total Blocking Time (TBT): Enhancing Page Interactivity and Responsiveness
Total Blocking Time (TBT) is a vital performance metric used by Google Lighthouse to measure the total duration, in milliseconds, of blocking tasks during the initial page load. This metric quantifies how long the main thread of the browser is occupied with tasks that block user interaction, affecting the responsiveness of your webpage.
During the page load process, the main thread handles crucial tasks such as JavaScript execution, style calculations, layout, and painting. When these tasks are prolonged, it can delay user interactions, making the page appear sluggish or unresponsive.
TBT focuses on the time period when the browser is busy executing JavaScript code and other blocking tasks that may delay user interactions like event handling or responding to user inputs. A lower TBT score indicates that the main thread is more available for user interactions throughout the loading process, leading to a more responsive and engaging user experience.
Strategies to Improve Total Blocking Time (TBT)
- Optimize JavaScript Execution Minimize the execution time of JavaScript by reducing the complexity of scripts and breaking them into smaller, more manageable chunks.
- Defer Non-Critical JavaScript Use techniques like defer and async attributes to delay the execution of non-essential JavaScript until after the initial page load.
- Minimize Render-Blocking Resources Reduce the impact of render-blocking resources by optimizing CSS and JavaScript, and consider inlining critical CSS to speed up the initial rendering process.
- Prioritize User Input Responsiveness Ensure that scripts and tasks do not block or delay the handling of user inputs, such as clicks and keystrokes, to enhance the interactive experience.
What is a Good TBT Score?
For an optimal user experience, aim for a Total Blocking Time (TBT) of less than 200 milliseconds when tested on average mobile hardware. Achieving this can significantly improve page responsiveness and overall performance, positively impacting both user satisfaction and SEO rankings.
Accessibility Metrics: Optimizing Your Website with Key Accessibility Metrics and Best Practices
How Lighthouse Evaluates Accessibility: Key Metrics and Best Practices
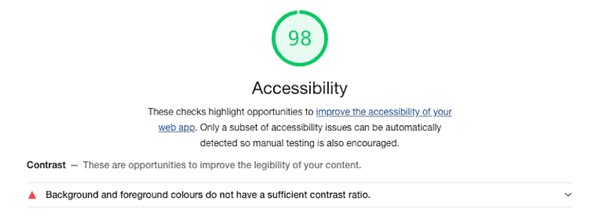
Google Lighthouse evaluates website accessibility by analyzing several critical factors, including proper HTML structure, alternative text for images, keyboard navigation support, and compliance with accessibility standards such as the Web Content Accessibility Guidelines (WCAG). It delivers valuable insights into your site’s accessibility performance and recommends improvements to enhance web inclusivity.
Best Practices

How Lighthouse Assesses Best Practices: Enhancing Website Performance and Security
Google Lighthouse evaluates your website’s adherence to best practices by examining key areas such as the use of secure connections (HTTPS), effective caching strategies, and optimized images and code. It identifies opportunities for improvement to boost your site’s performance, security, and efficiency.
Essential SEO Metrics for Website Optimization

How Lighthouse Evaluates SEO: Enhancing Visibility and Search Rankings
Google Lighthouse assesses SEO-related factors such as meta tags, headings, mobile-friendliness, and crawlability. It offers actionable recommendations to enhance your website’s visibility in search engine results, drive organic traffic, and improve search engine rankings.
FAQs About Google Lighthouse Performance Metrics
What is Google Lighthouse?
Google Lighthouse is a tool that evaluates a website’s performance, accessibility, SEO, and best practices, providing recommendations to improve load speed and user experience.
What metrics does Google Lighthouse measure?
It measures key metrics like:
– First Contentful Paint (FCP)
– Largest Contentful Paint (LCP)
– Speed Index (SI)
– Total Blocking Time (TBT)
– Cumulative Layout Shift (CLS)
How does improving Lighthouse scores boost SEO?
Optimizing Lighthouse metrics improves load speed and user experience, which can lead to higher search rankings.
What is a good FCP score?
A good FCP score is under 1.8 seconds, indicating faster initial content load.
Why is LCP important?
LCP measures the loading time of the largest visible content. A fast LCP (under 2.5 seconds) ensures better user experience and lower bounce rates.
What is CLS, and how do I improve it?
CLS measures unexpected layout shifts. A score of 0.1 or less is ideal. Improve it by reserving space for dynamic content and avoiding content shifts.
Why is TBT important?
TBT measures how long a site is unresponsive to user inputs. A low TBT (under 200 ms) ensures smooth interactivity.
How often should I run a Lighthouse audit?
Run audits regularly, especially after updates, to maintain optimal performance and SEO.
Does Lighthouse help with mobile optimization?
Yes, Lighthouse assesses mobile performance, including mobile-friendliness and load speed, helping you optimize for mobile-first indexing.
How can I improve TBT?
Reduce TBT by optimizing JavaScript execution, deferring non-essential scripts, and minimizing blocking resources.
Conclusion
Optimizing website performance is essential for delivering a fast, responsive, and engaging user experience. Tools like Lighthouse offer valuable insights into various performance metrics, helping developers pinpoint areas for improvement and make data-driven optimizations.
Key metrics such as First Contentful Paint (FCP), Largest Contentful Paint (LCP), Speed Index (SI), Total Blocking Time (TBT), and Cumulative Layout Shift (CLS) provide important measurements of different aspects of a website’s performance.
By understanding these performance metrics and their impact, developers can implement effective optimization strategies. These include minimizing render-blocking resources, optimizing images and code, prioritizing critical content, improving server response times, and addressing issues causing layout shifts. Regular monitoring, testing, and iteration are key to maintaining and enhancing website performance over time.
